 Traffic lights “designed to make trams slow”, study finds
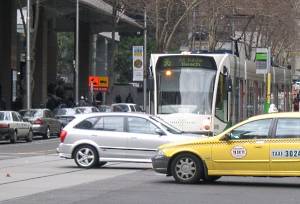
Melbourne’s trams are spending up to a third of their travel time needlessly stationary, at a cost of millions of dollars a year, according to research to be presented at a major transport conference today.
“We call it ‘dead time’,” said Tony Morton, who carried out the study on behalf of the Public Transport Users Association. “It’s the time a tram spends stopped at a red light, or stuck behind a car on the tram tracks, or inching through congestion – any time when it’s not doing something useful, either travelling or picking up and setting down passengers.”
To collect the data, Dr Morton spent seven months travelling with a stopwatch on peak-hour trams in Swanston Street and Lygon Street. Approximately 100 separate observations were collected in each peak direction. The stopwatch was set running whenever a tram finished loading and unloading passengers but was prevented by a red light from moving off. The actual time spent loading and unloading on arrival at a stop was not counted.
Among Dr Morton’s findings are that Lygon Street trams take an average of 19 minutes to travel the 2700 metres from Princes Street, at the edge of the City of Melbourne, to Collins Street in the CBD. “That’s about what a fit jogger can do,” says Dr Morton, “and that’s with trams running on their own track separated from the cars”. But of those 19 minutes, more than 6 minutes on average are ‘dead time’ – almost all of it waiting at red lights.
“Virtually every other city in the world with a major tram network has a system for moving trams quickly through intersections, just by stopping the cross traffic for five seconds,” says Dr Morton. “In Melbourne we make them wait with the rest of the traffic, as though they’ve got only one person inside instead of 50 or more.”
Compared to the delay caused by traffic lights, even traffic congestion had only a minor effect on the route studied. “On average, on the north part of the route between Carlton and Coburg there’s only 2 minutes of dead time,” he said. “Often there’s congestion in Brunswick in the evening peak when there’s no clearway, but it delays trams for only about 60 seconds on average. On the other hand, it’s common to be waiting an extra 60 seconds just at one red light.”
“People are put off using trams because they’re so slow,” said Dr Morton. “But the evidence shows trams are slow because the system is designed to make them slow. Traffic lights are set to favour cars and not to favour trams – nowhere more so than in the City of Melbourne itself.”
“Not only is this a horribly inefficient way to manage transport in the inner city; the taxpayer has to foot the bill too,” Dr Morton added. “If you take our smallest estimate of dead-time delay and apply it across the network, you find it’s responsible for some 200,000 hours of lost time per year, at a cost of nearly $10 million.”
“Yet the powers that be seem not to get it,” Dr Morton said. “All we hear about are more clearways and removing tram stops, which have a marginal effect at best. Giving trams genuine priority over cars, which typically carry one person each, is long overdue and Think Tram needs to do some thinking about it. With the recent surge in public transport use and the twin threats of peak oil and climate change, it’s pretty clear we need a shift in priorities.”
The study findings are being presented on Thursday at the Australasian Transport Research Forum at the Langham Hotel, Southbank, Melbourne (www.atrf07.com.au).
Main findings of the travel time study
- ‘Dead time’ accounts for up to two-thirds of the variability in travel time on the study route. In other words, variations in travel time are largely due to variations in the dead time.
- The most significant factor contributing to dead time is adverse traffic signals, with other significant factors being traffic congestion, fouling of tracks, tram congestion and operational events. With the exception of traffic congestion, the occurrence of these factors is largely within the control of transport authorities.
- Within the City of Melbourne boundary, dead time accounts on average for one-third of overall travel time, with a mean of nearly 6.5 minutes out of 19 minutes. This dead time accrues despite the tram running on reserved track where it is not subject to significant traffic congestion.
- Outside the City of Melbourne, dead time accounts on average for about 13% of overall travel time, with a mean of nearly 2 minutes out of 14-15 minutes. Traffic congestion does not always contribute to the dead time, but when present its typical contribution is in the order of one minute.
- The elimination of dead time, were it possible, would improve average travel speeds for trams in peak hour by around 50% within the City of Melbourne and by around 20% further north.
- Lack of punctuality (itself largely a consequence of adverse traffic signals) is an indirect contributor to delays, as a consequence of overcrowding.
- The presence of a clearway can avoid additional dead time due to traffic congestion of up to 60 seconds on a 2km stretch of mixed running. But the effect is not consistently observed, and is smaller than the additional dead time contributed on average by adverse traffic signals on the same section of route.
- The mean dead time observed off-peak is around 80% of that observed at peak times, except in the late evening.
Source: Morton, A.B. “Observational Analysis of Tram Delays in Inner Melbourne.” Paper presented at the Australasian Transport Research Forum, Melbourne, September 2007. (Available for download — PDF, 193Kb.)
Cost of dead time
Assume conservatively that the average dead time is 15% of travel time across the fleet, slowing trams from an average speed of 20kph to an average speed of 17kph.
State Budget figures indicate the total distance covered by trams in service is 23 million vehicle-km.
At an average speed of 20kph, trams spend 23/20 = 1.15 million hours in service each year.
At an average speed of 17kph, trams spend 23/17 = 1.35 million hours in service each year.
The difference (wasted time) is approximately 200,000 hours a year.
At an average cost of $45 per tram hour, the extra operating cost of the 200,000 wasted hours is $45 * 0.2 = $9 million per year.
This is a bare minimum estimate that disregards the very large dead times incurred in the city centre and other locations where traffic signals have long cycle times.

