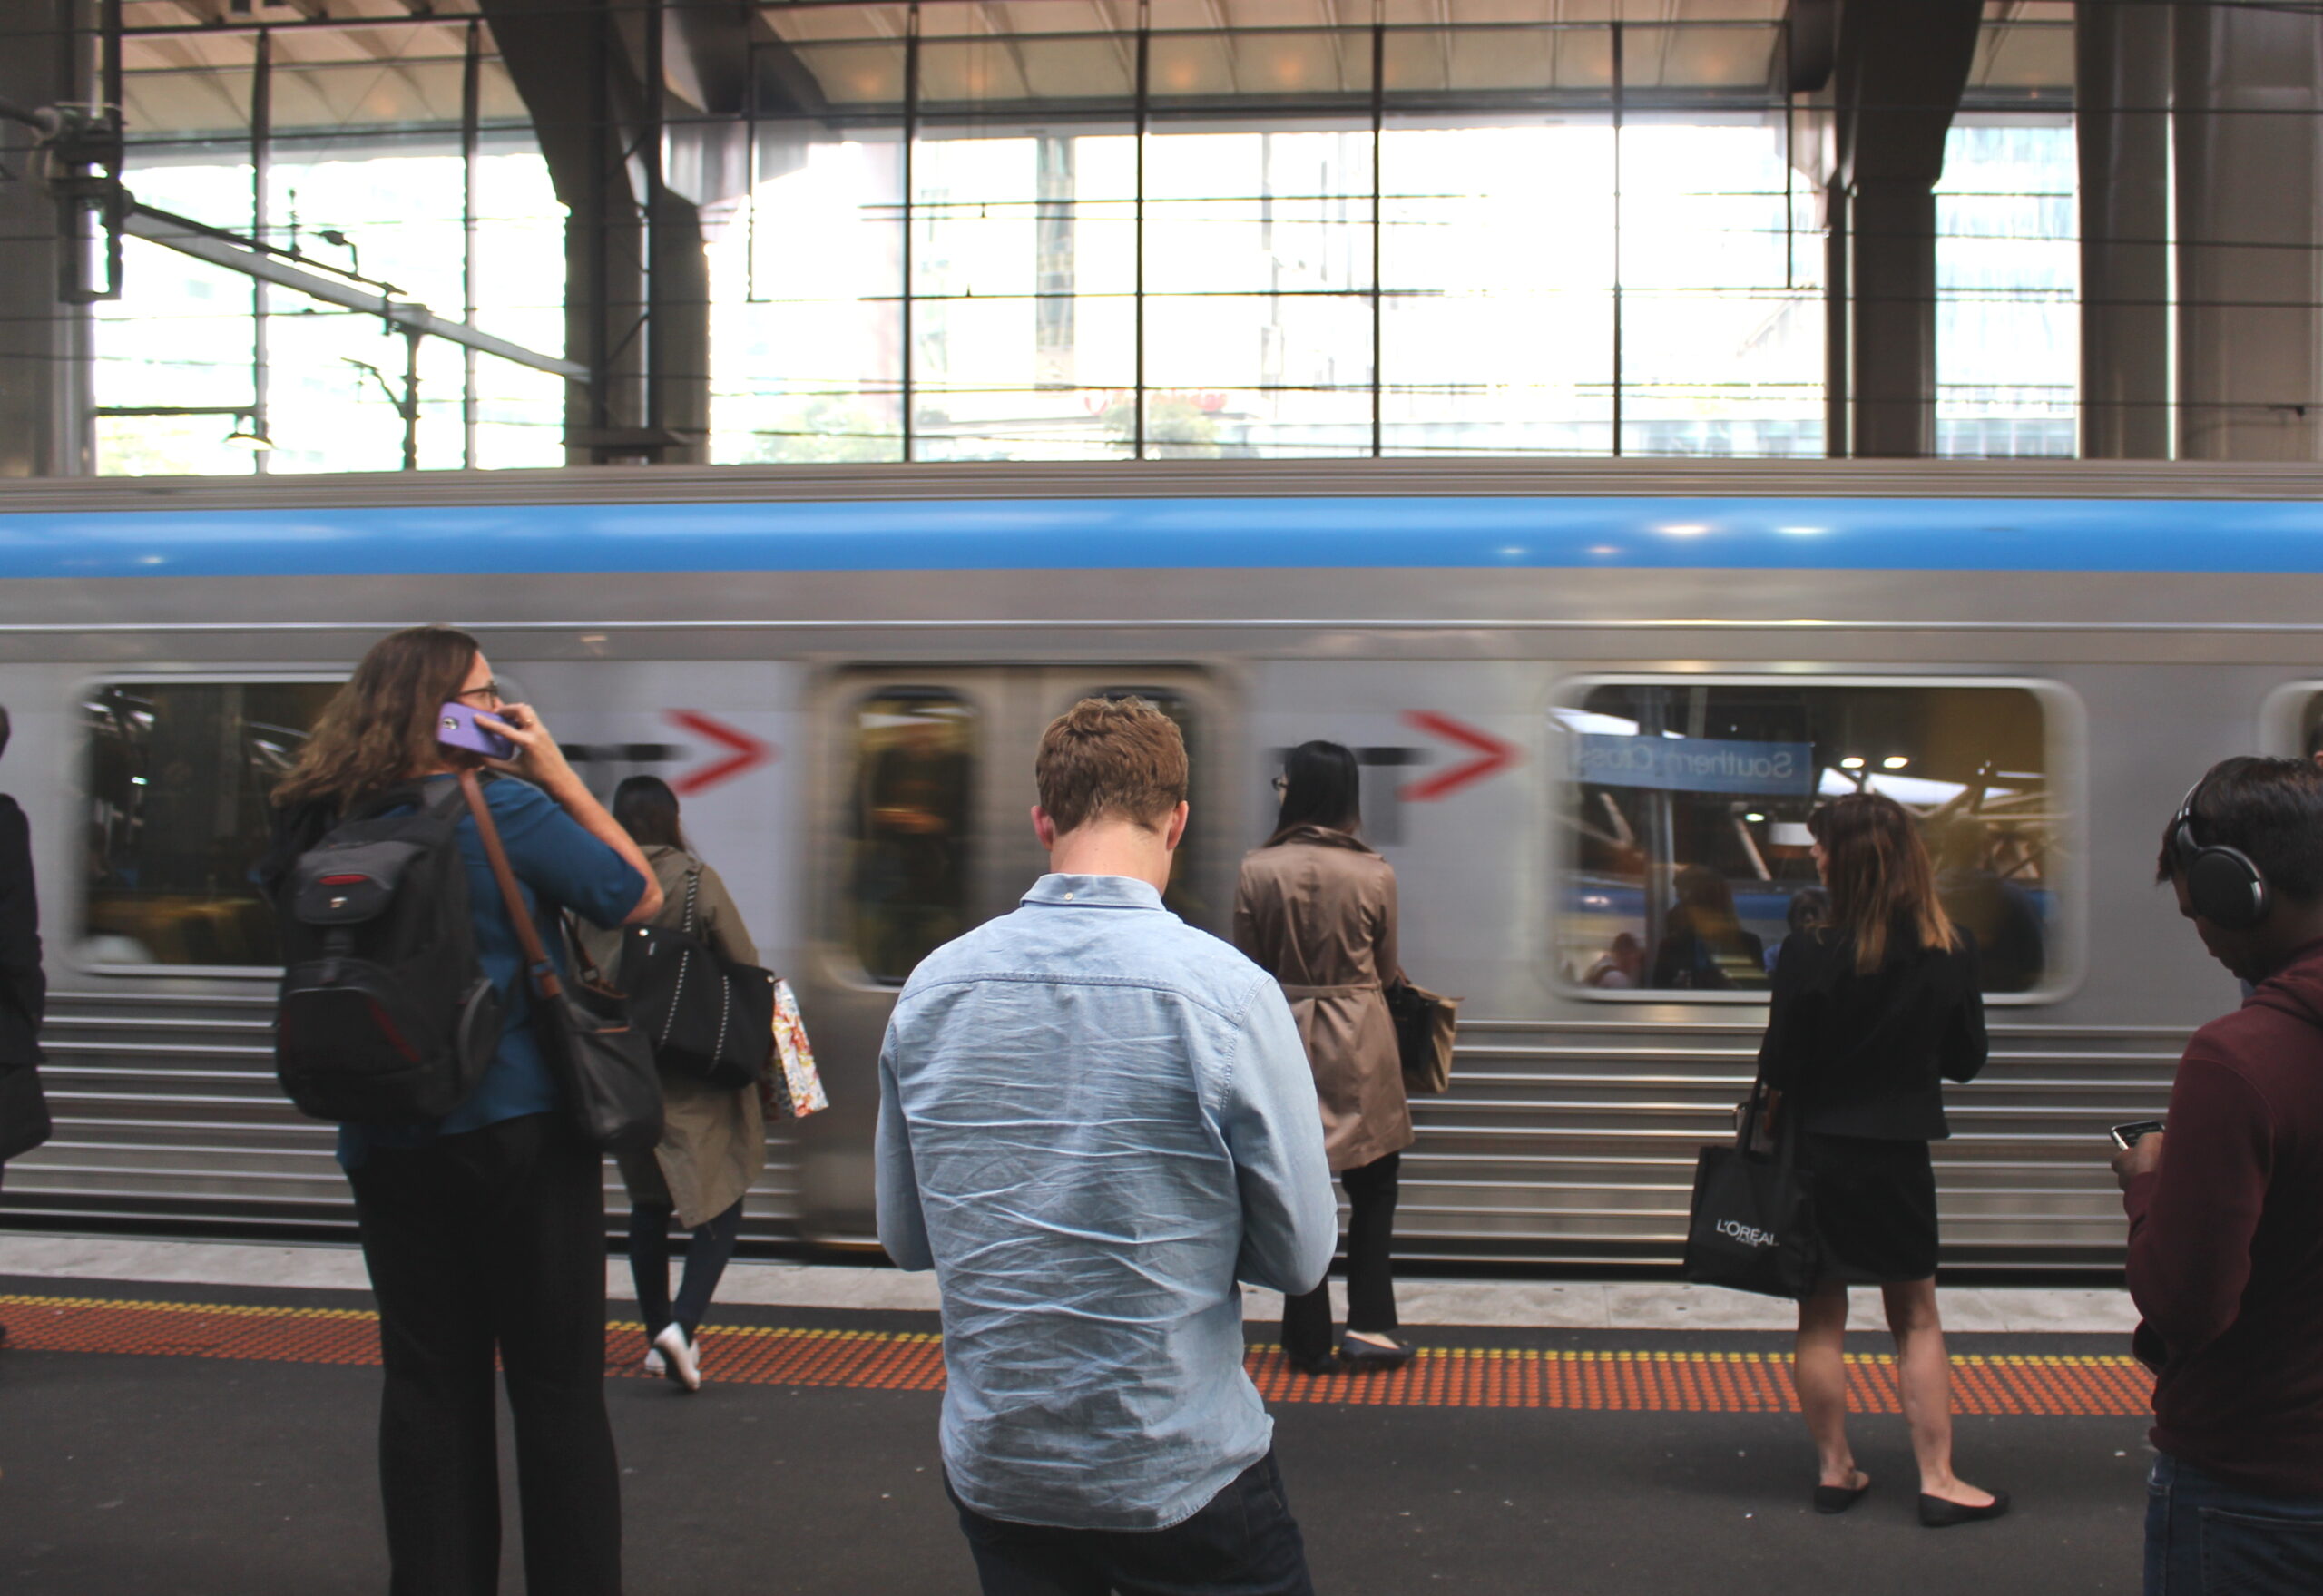
Myth: Subsidising car use promotes social equity
Fact: As with most consumer goods, car travel is used disproportionately by wealthy people. The 20% of households with the highest incomes account for over 30% of all household spending on petrol and other car expenses, while the 20% with the lowest incomes account for less than 10% of spending. So while it’s true that many low-income people are dependent on cars, it would actually be more socially equitable if standing costs like registration and insurance were charged according to distance travelled, and if low-income households were provided with more direct social assistance.
There are many social trends that underline the need for improved public transport in Australia’s suburbs. Chief among them is the plight of suburban working families, many of them on relatively low incomes, who are forced to juggle the costs of supporting a car for every adult household member along with hefty mortgages and the other costs of living. Ongoing work by the Urban Research Program at Griffith University has done much to highlight and track this important trend.
This has, however, led some social commentators (well-meaning or otherwise) to assume that measures that restrain car use will exert a disproportionate burden on the poor. Even if current policies result in a subsidy to car use, it may be argued, there is a measure of social justice to this because less-well-off families are among the beneficiaries. The same argument works against measures that are intended to reduce the cost burden on those who voluntarily reduce their car use, such as levying registration and insurance on the basis of distance travelled instead of as a fixed annual charge.
Problem with [a per-kilometre charge] is that richer people tend to live in inner suburbs and have much better public transport options, so they don’t need to drive to commute and when they do it’s for a comparatively smaller distance. In contrast, poorer people, living in outer suburbs, generally have to commute further and have far fewer, and much worse, public transport options. So it doesn’t sound particularly fair or equitable.
—Rego per kilometre idea hits poor hardest, An Onymous Lefty, April 2010
The problem with this argument is it’s a vast overgeneralisation. Granted, inner-urban households are skewed toward the wealthy end of the scale as these areas have become more desirable; likewise, people on lower incomes tend to locate in the outer suburbs where homes are more affordable. But it’s often forgotten that the outer suburbs are home to a lot of wealthy people also, and some suburbs with awful public transport (such as Templestowe or Rowville) are among the wealthiest in Melbourne. Meanwhile the inner suburbs continue to have sizeable low-income populations, particularly age pensioners and students.
Moreover, it’s far from true that wealthy people in the inner suburbs will automatically find Melbourne’s public transport useful just because it’s better than what’s available on the fringe. In reality, no Melbourne suburb, no matter how close to the CBD, actually has the network in place to allow public transport to compete with the car. (Some suburbs have half a network – such as frequent services north-south but virtually nothing east-west – but as our Squaresville page explains, half a network is much, much less than half as effective as a full network.)
But one doesn’t have to just take such remarks on trust: the data exist to show that while the rich-poor divide in car use certainly exists, it runs in the opposite direction to what the commentators suggest. Statistics on household expenditure show that spending on petrol and other car expenses is not only disproportionately high for the wealthiest households, but also disproportionately low for the poorest.
| Proportions of household car spending by household income | ||||||
|---|---|---|---|---|---|---|
| Income quintile | Average weekly spending | |||||
| Lowest 20% | … | Median 20% | … | Highest 20% | ||
| Motor vehicle fuel | 9.0% | 14.6% | 21.2% | 25.3% | 29.8% | $32.85 |
| Registration and CTP | 9.8% | 14.5% | 19.9% | 25.5% | 30.3% | $13.14 |
| Servicing, licence and fees | 9.0% | 14.0% | 16.4% | 27.2% | 33.3% | $18.57 |
| Motor vehicle purchase | 7.1% | 11.0% | 18.4% | 28.0% | 35.6% | $49.50 |
| Parts and accessories | 7.9% | 12.3% | 21.5% | 27.3% | 31.1% | $7.19 |
| Discretionary insurance | 8.4% | 13.0% | 18.3% | 24.3% | 36.0% | $10.65 |
Source: Australian Bureau of Statistics. Household Expenditure Survey, Australia: Detailed Expenditure Items, 2003-04. Excludes business expenditure on private vehicles, and expenditure on purchase of caravans, trailers and bicycles. Totals may not add to precisely 100% due to rounding.
One sees that in every category of spending, the wealthiest 20% of households account for around 30-35% of total expenditure. Meanwhile the poorest 20% consistently account for less than 10% of spending. Combining the first two columns, it turns out that the ‘poorest’ 40% of all households account for less than one-quarter of spending in each category. This applies as much to ongoing costs such as fuel, rego and insurance, as to capital costs such as purchase of cars and parts.
This pattern of spending is the same as for consumer goods and services in general. As a general rule, the more people have, the more they spend. Hence the supposedly breathtaking conclusion of the economic analysis done for the ACF Consumption Atlas: that people in inner-city areas account for as much or more greenhouse pollution as those in outer suburbs. All this really reveals is that people in inner-cities tend to be somewhat wealthier and therefore spend more, making them responsible for a greater share of all the country’s economic turnover.
This also means that subsidising car use (or equivalently, encouraging motorists to impose costs on others without charging for the privilege) is a very inefficient way to promote social equity, since most of the subsidy is absorbed by wealthy households. It is much more equitable to improve the alternatives to car use across the board, and to provide direct social assistance to low-income households, including to support that portion of car use that remains necessary. (In rural areas, for example, it may not be possible to provide adequate public transport.)
So what does this mean if, for example, registration and compulsory third-party insurance were charged based on the amount of travel – say by building it into the price of fuel and abolishing the annual fee? At present, all car owners pay the same amount per year no matter how much driving they do, even though the risk of being in a crash depends on the amount of travel. So there is effectively a subsidy from those who own cars but don’t drive them much, to those who drive a great deal. The latter are much more likely to come from the wealthier half of the population.
From the table above one sees that the poorest 20% of households pay 9.8% of all registration and CTP fees, but only 9.0% of petrol bills. This means that levying these fees as part of the price of petrol, instead of as a fixed annual payment, would actually leave poor households on average slightly better off. (This assumes that the change is done in a revenue-neutral manner and that existing concessions, such as those for pensioners, are retained.)
Of course, none of this should detract from the importance of improving the alternatives to car use. Public transport networks can and should be put in place, easily and affordably, to allow both rich and poor people in both inner and outer suburbs to leave their cars at home and use public transport. But this does not preclude other measures being taken to level the playing field between those who currently receive subsidies for driving long distances, and those who do not but wind up financially worse off.
Last modified: 30 June 2010

